Protein structure classification
1 Structure comparison and alignment
To understand the diversity and function of proteins, it is important to compare their sequences and structures. This helps to find common patterns and understand their diversity and evolutionary history. By measuring and analyzing these similarities, scientists can classify proteins and determine their relationships in terms of function and evolution. This process is also crucial in protein modeling, as it helps identify, evaluate, and choose intermediate models
It is essential to clarify the distinction between alignment and superposition, as these terms are frequently conflated in the literature. A structural alignment aims to identify similarities and differences between two structures, whereas structure superposition displays the structures based on specific criteria, typically derived from a prior structural alignment. Consequently, superposition algorithms seek to minimize the distance between structures by identifying a transformation that achieves either the lowest root-mean-square deviation (RMSD) or the maximum equivalences within an RMSD cutoff.
\[ RMSD(v,w)=\sqrt{\frac{1}{n} \sum_{i=0}^n{||v_{i}-w_{i}||}^2} \tag{1}\]
The RMSD can be calculated for any pair of molecules. In the context of proteins, we often refer to the RMSD of the alpha-carbons. A superior alignment will facilitate a better superposition. Therefore, although alignment and superposition are distinct processes, the RMSD can serve as an indicator of both; the lower the RMSD, the better the alignment/superposition. It is important to note that RMSD is an actual distance measure, not a score. That implies that we only can obtain the RMSD for aligned residues, not for the whole sequence of any of the two proteins. Therefore, an RMSD of 1 Å may indicate a close distance but, if it involves very few amino acids, it does not necessarily suggest good similarity. Both the RMSD value and the number of aligned residues must be considered for accurate analysis.

cealign algorithm implemented in PyMol. The RMSD and the number of aligned residues for each pair of structures is indicated.
When comparing two protein structures, the RMSD value you obtain can vary depending on the alignment or superposition algorithm used. Different methods look at structural similarity in different ways, so they do not always produce identical results. Among the many available tools, three of the most commonly used are CEalign, TM‑align, and DALI.
CEalign (Shindyalov and Bourne 1998) builds a structural alignment by focusing on short matching fragments, called Aligned Fragment Pairs (AFPs). These AFPs capture local geometric similarity between Cα atoms. Starting from these local matches, the algorithm extends and refines the alignment using a combination of combinatorial techniques and dynamic programming. CEalign is implemented in PyMOL and other molecular visualization programs, making it widely accessible to researchers
TM-align (Zheng et al. 2019) uses dynamic programming to find the alignment that maximizes the TM‑score, a weighted version of RMSD designed to reduce the impact of local structural differences. The method begins with heuristic initial alignments (for example, based on secondary structure or fragment matching) and then iteratively improves the alignment until it converges on the best global match under the TM‑score. Because of its weighting strategy, TM‑align is particularly good and fast at comparing overall protein folds.
DALI (Holm 2022) takes a very different approach. Instead of beginning with a superposition, it compares proteins by analyzing their Cα distance matrices, which represent all pairwise distances within each structure. Based on these matrices, DALI computes a score (Z), and only afterwards generates a superposition and RMSD. This makes DALI a highly sensitive method for detecting remote structural similarities, although it is also computationally intensive. To address this, the DALI server provides pre‑calculated distance matrices for proteins in major databases, enabling efficient structure‑based searches.
Because traditional algorithms can be slow for large databases, newer tools such as FoldSeek (Kempen et al. 2023) use AI and protein language models to dramatically speed up structural searches, reflecting the growing role of machine learning in structural bioinformatics, as we will discuss in the section devoted to Alphafold and other AI-based methods.
2 Classification of Proteins
Classification of protein sequences helps us understand the diversity of different proteins by examining their sequences, known as the protein sequence space (the mathematical concept of space). On the other hand, classifying protein structures involves grouping proteins based on their structural relationships. Some classifications consider the structural neighborhood (structural continuum), while others use the concept of protein evolution as the main factor of diversification, resulting in a discrete rather than continuous protein structure space (Andreeva 2012).
Almost seven decades after the first three-dimensional structure of a protein, myoglobin, was solved Kendrew et al. (1958), the number of protein structures in the databases range from nearly 250,000 experimentally obtained structures in the RCSB PDB to hundreds of millions of predited structures in Alphafold and ESM databases (see below).
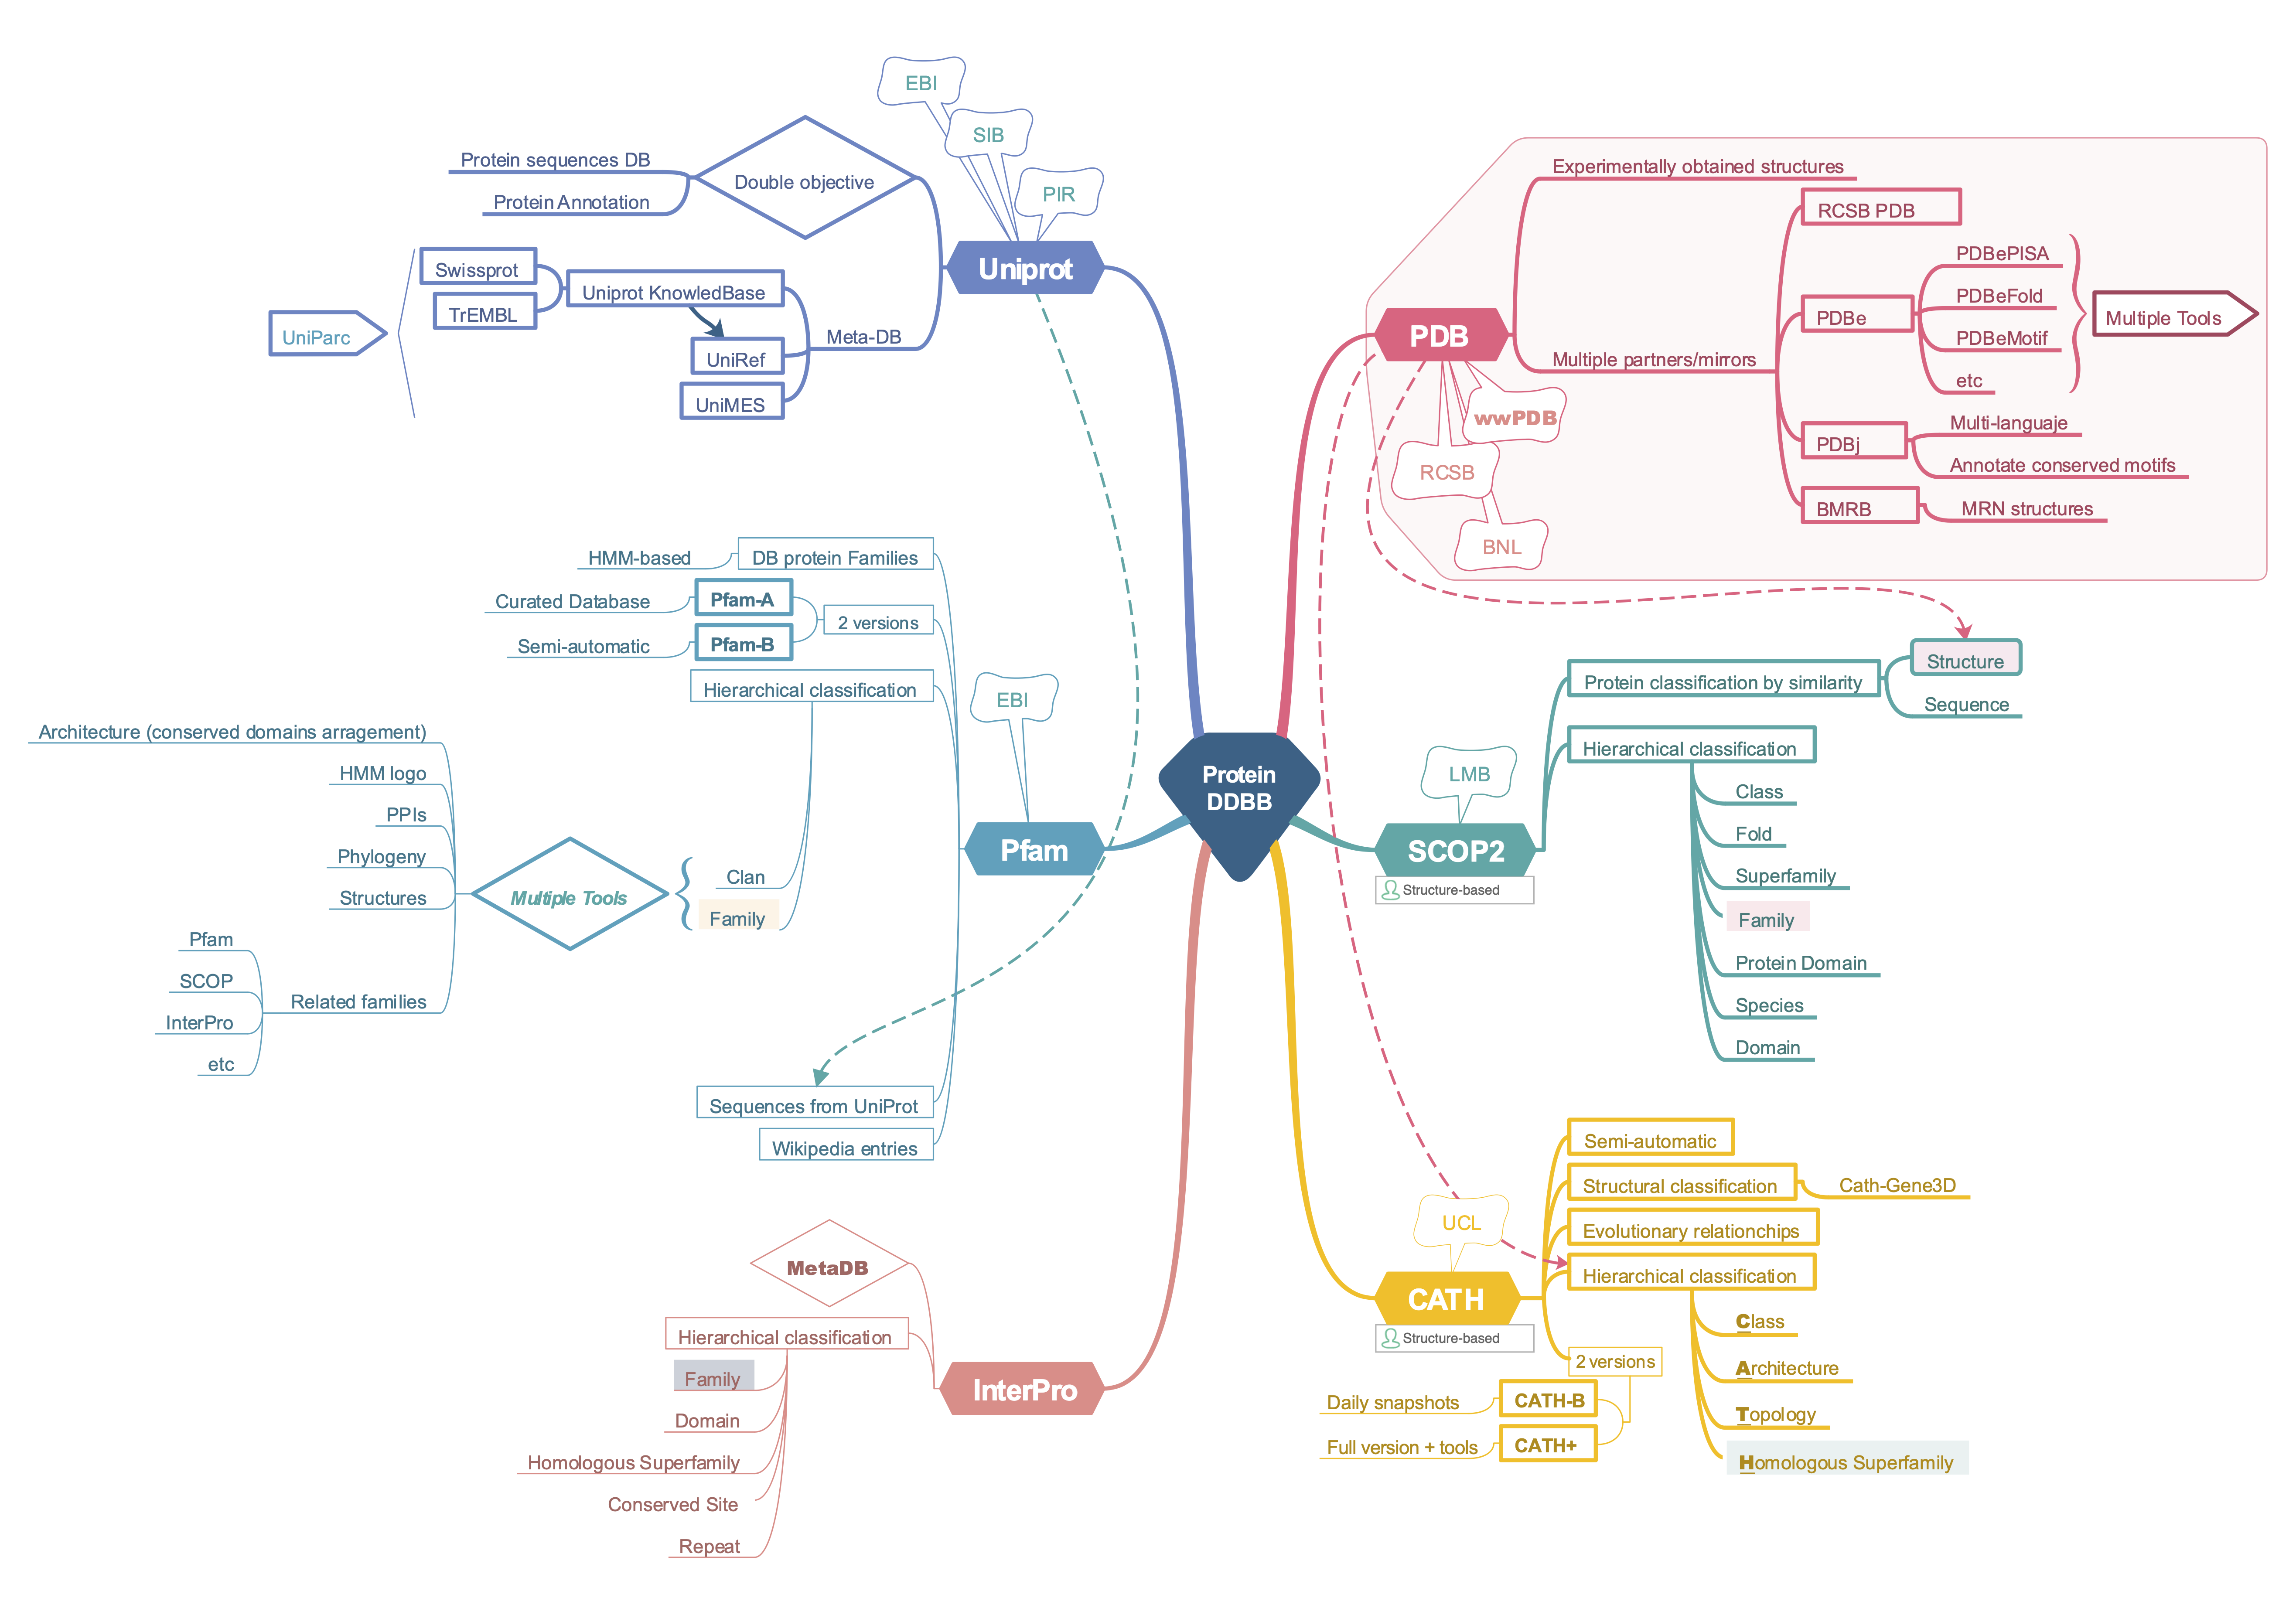
This section does not intend to provide an exhaustive review of all protein databases. Many of the databases discussed are likely already familiar to the reader. Consequently, we will not cover in detail the NCBI Protein Database, which is widely used for various purposes and is likely mentioned in other courses. The NCBI Protein Database primarily serves as a main repository of sequences, with minimal emphasis on the analysis of protein diversity and classification. This section will highlight the main differences and applications of Pfam, Uniprot, Prosite, PDB, SCOP, and CATH. For more detailed information, please refer to the references cited below.

In bioinformatics, databases are often classified as primary or secondary. Primary databases contain experimentally derived data such as nucleotide sequences, protein sequences, or macromolecular structures. It is important to note that once a database accession number is assigned, the data in primary databases remain unchanged, forming part of the scientific record. In contrast, secondary databases include data derived from analyzing primary data. These databases often utilize information from numerous sources, including other databases and the scientific literature. They are typically highly curated and involve a complex combination of computational algorithms and/or manual analysis and interpretation to generate new knowledge from the public record of science.
Although the distinction between primary and secondary databases has become less clear in recent times due to the integration of data from various sources, some differences can still be discerned. The main primary databases for protein sequences include NCBI Protein and RCSB-PDB for protein structures. UniProt also hosts a primary sequence database named TrEMBL and, since 2002, incorporates the PIR-PSD database, which unites the resources of the Protein Information Resource, EMBL, and SIB into a single meta-database (see PIR-PSD). On the other hand, RCSB-PDB serves as the major structural primary database, while SCOP2 and CATH are notable secondary databases.
All of the databases we describe here allow programmatic and/or API access, commonly with BioPython and R packages, which significantly increases the possibilities for scripting and batch data analysis.
Sequence databases
Uniprot
The Uniprot databases are managed by the UniProt consortium, established in 2002 by EMBL-EBI, SIB, and PIR. Nowadays, UniProt can be considered a metadatabase as its entries contain information from various sources. It was created with two main goals: to establish a comprehensive, non-redundant protein sequence database and to enrich that database with detailed annotations. These annotations include protein and gene families, function and structure-function data, interactions with other proteins or cofactors, localization, expression patterns, variants, and more. Thus, it aims to fulfill the objectives of both primary and secondary databases.
The central hub of the UniProt databases is the Uniprot Knowledgebase. It is a collection of functional information on proteins, with accurate, consistent, and rich annotations. The UniProtKB consists of two internal databases: one section contains manually-annotated records with information drawn from literature, community suggestions, and curator-reviewed computational analysis. The other section includes computationally analyzed records. These sections are referred to as “UniProtKB/Swiss-Prot” (reviewed, manually annotated) and “UniProtKB/TrEMBL” (unreviewed, automatically annotated), respectively.
In recent years, UniProtKB has incorporated structural data from the Alphafold database, in addition to cross-references to structural information. See the module “State-of-the-art protein modeling with Deep Learning-based methods” for more information.
UniProt contains sequences with varying levels of annotation detail in two complementary databases: Uniparc and Uniref. Briefly, UniParc (UniProt Archive) is a comprehensive and non-redundant database that includes most publicly available protein sequences worldwide. UniParc avoids redundancy by storing each unique sequence only once and assigning it a stable, unique identifier (UPI), which allows the identification of the same protein from different source databases. A UPI is never removed, changed, or reassigned. On the other hand, UniRef (UniProt Reference Clusters) provides clustered sets of sequences from UniProtKB (and selected UniParc records) to ensure complete coverage of the sequence space at various resolutions while hiding redundant sequences (but not their descriptions) from view. The UniRef100 database combines identical sequences into a single UniRef entry, displaying the sequence of a representative protein, the accession numbers of all merged entries, and links to the corresponding databases. UniRef90 is built by clustering UniRef100 sequences using the MMseqs2 algorithm (Steinegger and Söding 2018), so each cluster consists of sequences with at least 90% sequence identity and 80% overlap with the longest sequence (the seed sequence ) of the cluster. Similarly, UniRef50 is built by clustering UniRef90 seed sequences that have at least 50% sequence identity and 80% overlap with the longest sequence in the cluster. UniParc and UniRef contain only protein sequences; all other information about the proteins must be retrieved from the source databases using database cross-references.
Pfam
Pfam is a protein database that aims to classify sequences by their evolutionary relationships. It was founded in 1995 and it has been very useful for functional annotation of genomic data. Pfam’s website (http://pfam.xfam.org/) was closed by the end of 2022. However, Pfam database was not discontinued, but integrated into the InterPro site (see the Xfam Blog entry).
Pfam uses HMM profiles to classify proteins into families, which are grouped into clans. Check out the EBI course about using Pfam: https://www.ebi.ac.uk/training/online/courses/pfam-creating-protein-families/
The current release (37.1) contains 23.794 entries and 751 clans. Pfam was designed as a database that should be often updated in the fast-forward genomic era. To this aim, they use two alignment types. Each Pfam family has a seed alignment that contains a representative set of sequences for the entry. A profile hidden Markov model (HMM) is automatically built from the seed alignment and searched against a sequence database called pfamseq using the HMMER3 software (http://hmmer.org/). All sequence regions that satisfy a family-specific curated threshold, also known as the gathering threshold, are aligned to the profile HMM to create the full alignment (Mistry et al. 2020).
In addition to the HMM-based Pfam entries (Pfam-A), the Pfam profiles are used to provide a set of unannotated, computationally generated multiple sequence alignments called Pfam-B. However, in the last Pfam versions, the Pfam-B alignments are presently only released on the Pfam FTP site.
Pfam has also been used in the creation of other resources such as Rfam (RNA families) and Dfam (transposable DNA elements).
InterPro
InterPro aims to be a functional secondary database, by classifying proteins into families, domains, and important sites. To classify proteins in this way, InterPro uses predictive models, known as signatures, provided by several different databases (up to 13) that make up the InterPro consortium. InterPro combines those different signatures representing equivalent families, domains, or sites, and provides additional information such as descriptions, literature references, and Gene Ontology (GO) terms, to produce a comprehensive resource for protein classification (see Blum et al. (2021)).
InterPro database is updated every 2 months and it is very useful for annotation of ORFans or divergent proteins. In the last years, it has integrated more resources, including Pfam, as well as structural data and predictions, giving rise to a very handy resource for multiple purposes in protein science (Paysan-Lafosse et al. 2023).
Interpro was created as a sequence DDBB, but it is currently in between. I’d rather say that it is more a “meta-database” containing sequence and structure information.
Structure databases
RCSB-PDB
The Protein Data Bank (PDB, www.rcsb.org) database is the major macromolecule structural primary database (Burley et al. 2020). It contains mostly protein structures, but also spans nucleic acids and nucleoprotein complexes. PDB turned 50 in 2021 and you can see a detailed overview of its history in the RCSB-PDB site.
Briefly, the PDB was established in 1971 at Brookhaven National Laboratory with only 7 structures. Then, the Research Collaboratory for Structural Bioinformatics (RCSB), formed by Rutgers, UCSD/SDSC, and CARB/NIST, became responsible for the management of the PDB in 1998 in response to an RFP and a lengthy review process. In 2003, the Worldwide Protein Data Bank (wwPDB) was formed to maintain a single PDB archive of macromolecular structural data that is freely and publicly available to the global community. It consists of organizations that act as deposition, data processing and distribution centers for PDB data.
PDB structures are largely obtained by X-ray crystallography, but it accepts derived from EM and RMN data since 1989 and 1991, respectively. Indeed, the BMRB (Biological Magnetic Resonance Bank) has partnered with the PDB since 2006 and the EMBD (Electron Microscopy Data Bank) since 2021. Furthermore, starting September 2022, the PDB also contains computed models from the Alphafold database (which we will discuss later in this course) and RoseTTAFold-ModelArchive. Thus, the PDB database is the major hub that centralizes biological structures nowadays.
PDB database has four mirrors and websites (RCSB, Europe, BMRB, and Japan) with mainly overlapping information, although they have some specialization. The RCSB PDB site has also an educational section (PDB-101) with very useful info and resources for teaching and learning structural biology and the work with PDB structures.
The PDB entries contain all the information about the structure, spanning from the protein sequence and source to the experiment details, as well as the structure assessment (see Structural quality assurance section) and visualization. You can download all this information and the structure coordinates in diverse file formats.
SCOP
The Structural Classification of Proteins (SCOP, http://scop.mrc-lmb.cam.ac.uk) database is a classification of protein domains organized according to their evolutionary and structural relationships in hierarchical categories. Like in the Linnaean taxonomy, discret units (domains) are grouped hierarchially on the basis of their common structural and evolutionary relationships. The major unit is the family that groups related protein domains with clear evidence for their evolutionary origin while the superfamily brings together more distantly related protein domains. Further, superfamilies are grouped into distinct folds on the basis of the global structural features shared by the majority of their members. Domain definitions are provided for the two main levels of the SCOP classification, family and superfamily, and the domain boundaries for each of these can coincide or differ (Andreeva et al. 2020).
For each group, a representative is selected based on its sequence (UniProtKB) and structure (PDB) and used for SCOP classification. Thus, the SCOP domain boundaries are assigned to both, the PDB and UniProtKB entry.
CATH
CATH (www.cathdb.info) is a free, publicly available resource that identifies protein domains within proteins from the Protein Data Bank and classifies them into evolutionary-related groups according to sequence, structure, and function information. It assumes that related proteins which fold alike often exhibit similar functions (this only could be demonstrated if we find intermediates). CATH uses a hierarchical classification scheme where the units compared and classified are structural domains. Domains, defined here as globular structural domains capable of semi-independent folding, are extracted from experimentally determined protein structures available in the PDB database. The domains are classified into the following hierarchical levels that compose the CATH name: Class (C), Architecture (A), Topology (T), and Homologous superfamilies (H).
In contrast to SCOP, CATH is based in semi-automatic methods, rather than manual curated approach for classification. CATH uses a combination of several structure-based (SSAP, CATHEDRAL) and sequence-based (Needleman-Wunsch-based sequence alignments, Jackhmmer, Profile Comparer, and HHsearch) algorithms to assess the similarity of domains to each other and to identify protein homologues (Sillitoe et al. 2021).
CATH has a sister resource, Gene3D, that adds in additional protein domain sequences with no known structure, which brings the current total number of domains in CATH-Gene3D up to 95 million.
CATH database is updated quite regularly through daily snapshots (CATH-B), but a full release with more tools, named CATH+ is released every 12 months. CATH-plus contains functional families (CATH-FunFams), structural clusters, and other tools (Sillitoe et al. 2021).
Current and future strategies in protein databases
There is a significant trend towards the cross-referencing and integration of diverse data within metadatabases. An exemplary case is the Human Protein Atlas which provides information about proteins classified by cell type or tissue, along with details on splicing variants, mutants, and more. Additionally, it is important to acknowledge the new structural databases, such as Deepmind’s Alphafold Database (Bertoni et al. 2026) and the ESM Metagenomic Atlas, which house millions of protein structures predicted using deep-learning methods. There are also specialized databases, like BFDV (Kim et al. 2025), that contain viral protein structures obtained through Alphafold and can be searched using Foldseek (Kempen et al. 2023), a AI-based method designed to identify structural similarities (see section Protein Modeling in the AlphaFold era).
Given the recent boost in the capacity for accurately obtain protein models, some author suggested (or desired) that future databases contain not only protein sequence variants and protein complexes, but also diverse conformations for each structure, which would help to gain insights into their function and biological role (Beck et al. 2024).
3 In class exercise: Protein Databases
The goal of this exercise is to get familiar with protein structures and their domain organization.
| Structures |
|---|
| 2MNA |
| 2WB0 |
| 1C0A |
| 1QUM |
| 5ZHZ |
| 5CFE |
| 1DE9 |
| 6WCD |
| 1AKO |
| 6KHY |
| 1EBM |
1. Explore the structures and identify similarities and differences by naked eye.
2. Use structural databases (CATH, Scop2 or PDB) to classify the proteins.
First, describe the structure in your own words. Then, using generic terms applicable to any hierarchical classification system, classify this small dataset of structures.